
On August 6 and 7, 2026, Gurgaon got hit with heavy monsoon rain two days running. This time, instead of just posting about it after the fact, residents used FloodWatch to drop a pin on the exact spot that flooded near them — in real time, as it happened.
201 reports came in over those two days, filed by 131 different people — the overwhelming majority of everything reported that week. That's not a random scatter across the city — when we grouped every report by location, clear patterns emerged: one spot stood out sharply above the rest, and dozens of reports landed on places already flagged by the government or the media as known trouble spots.
We took every waterlogging report filed through FloodWatch during the Aug 6–7 storm, excluded duplicates flagged by our spam detection, and grouped the remaining reports into clusters wherever multiple reports landed within about 180 metres of each other — regardless of which sector or colony boundary they happened to fall in. We then checked each cluster against the 180 waterlogging locations already identified by government (GMDA) surveys and media coverage, matching anything within 400 metres. Clusters with 3 or more independent reports that don't match anything on that list are flagged below as possibly undocumented.
The worst spot in the city
Service road along the flyover, Laxman Vihar
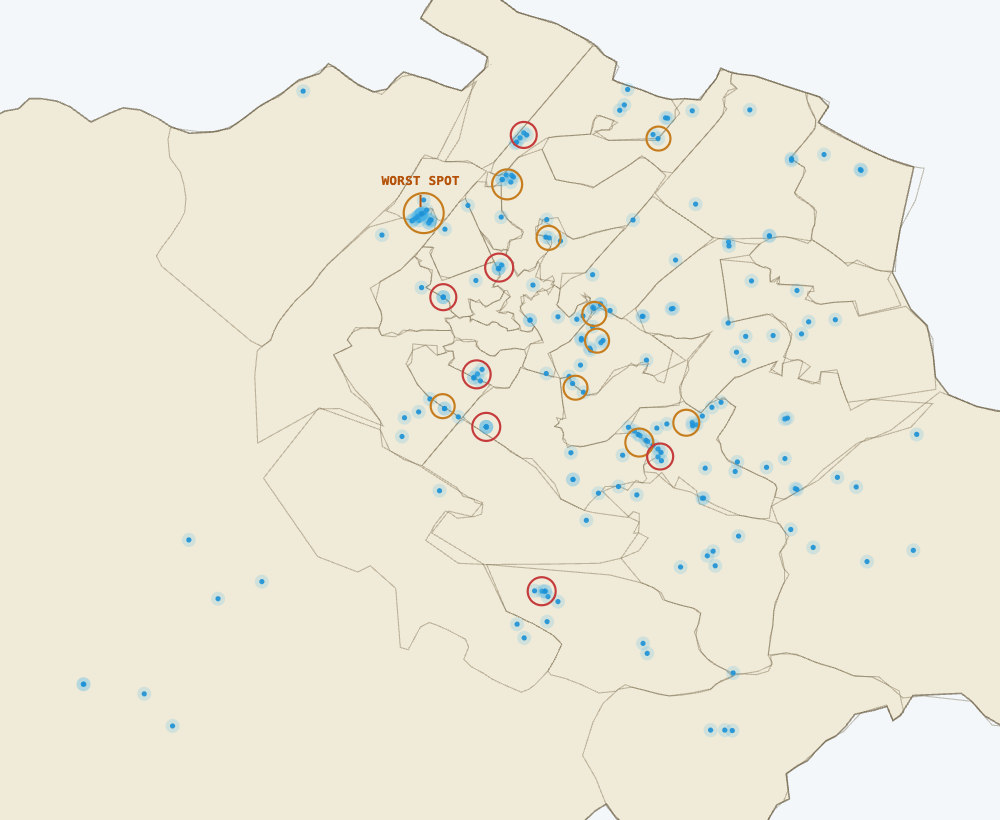
No other location came close. Sixteen separate reports from fourteen different phones landed within meters of each other here, spread across both August 6 and 7 — this isn't one person reporting repeatedly, it's a genuinely large number of residents independently flagging the same stretch of road. This spot is already on the government's own hotspot survey, so this storm's reports are, in effect, real-time confirmation from the people who live there that a documented problem is still very much a problem.
And it isn't a new problem. Residents in the area say this stretch has been called out as a flooding hotspot for at least the last two years — yet whatever was supposed to follow that listing doesn't appear to have happened. The same underpass flooded again this storm, in exactly the way locals describe it flooding before. A location being on the official list only matters if it leads to action; on this evidence, for this spot, it hasn't.
Where every report landed
Plotted on Gurgaon's actual ward map. Every dot is one resident's report. Amber rings mark spots that match a known government or media-identified hotspot; red rings are new clusters not on that list.
Known hotspots, reconfirmed by residents
Beyond the Laxman Vihar flyover, nine other government or media-identified hotspots got two or more independent citizen reports nearby during this storm — meaning residents, without being prompted or told where the "official" hotspots are, reported the same locations on their own:
- 1Service road along the flyover, Laxman Vihar16
- 2J Block, Ashok Vihar, Phase III5
- 3Sector 47, near DPS4
- 4Sector 463
- 5Sector 15 Part II, along the citizen park2
- 6Bandh Road, near H.No. 1094, Sector 15 Part II2
- 7Sector 10A Market, near Gate No. 72
- 8HUDA nursery corner2
- 9Chaudhary Baktawar Singh Road2
- 10Sheetla Mata Mandir Road2
Spots the official list may be missing
Seven clusters had three or more reports from different residents but sit more than 400 metres from anything on the government or media hotspot list. We're not claiming these are confirmed new hotspots — clustering by GPS proximity is a starting point, not a survey — but they're worth a second look:
- 1Near Sector 7043 different households
- 2Near Sector 3343 different households
- 3Near Shivji Park42 different households
- 4Near Bhim Nagar41 household, repeat reports
- 5Near Sector 7 Housing Board32 different households
- 6Near Sector 47 Mayfield Garden31 household, repeat reports
- 7Near Sector 2&3 Palam Vihar31 household, repeat reports
Where the reports came from
Reports weren't confined to one part of the city. Across the two days, residents reported from 32 wards, 55 sectors, and 78 colonies. By raw count, the most-reported areas were:
- 1Tek Chand Nagar12
- 2Sector 15-29
- 3Surat Nagar Phase 28
- 4Sector 236
- 5Sector 2&3 Palam Vihar6
Tek Chand Nagar and Surat Nagar Phase 2 together account for a large share of reports in old Gurgaon — and they're the two colonies that sit either side of the Laxman Vihar flyover, the storm's clear worst spot.
None of this happens without people actually reporting. A model can predict where water is likely to collect based on terrain and drainage data — and ours does — but only residents on the ground can confirm, in real time, that it's actually happening. That's what these 201 reports are: not a prediction, but a record of what really flooded, filed by the people it flooded on.
See something flood near you?
Drop a pin on the FloodWatch hotspot map — it takes 20 seconds, and it's exactly how this list gets built.
Data notes: 201 reports from 131 unique devices, filed via FloodWatch between August 6–7, 2026 (IST), excluding reports flagged as duplicates by our spam detection. Clusters formed from reports within ~180m of each other. Cross-referenced against 180 government (GMDA) and media-identified waterlogging locations; a match requires a citizen report within 400m of a listed hotspot.
Clustering by GPS proximity is a useful signal, not a survey-grade confirmation — device GPS accuracy varies, and a cluster reflects where phones were, not necessarily the exact metre of standing water. Treat the "possibly undocumented" list as leads worth checking, not confirmed findings. The claim that the Laxman Vihar flyover has been a known hotspot for at least two years reflects resident accounts, not a FloodWatch-verified timeline.